
GENERAL ASSEMBLY UX/UI CERTIFICATE:
500 + hours of Immersive UX/UI Design, using UX Principles, UX Research, Affinity Mapping, Wireframing, Prototyping, User Testing, Agile Development, working individually and on teams. I was voted “Natural Born Leader.”
CASE STUDY: CREATING A WEBSITE FOR COMPANY “RESEARCH BASE”
We had the pleasure of working with the amazing Mark Tegtmeier, Lead UX Designer of UserIQ, below.


We were given the task of creating a brand new site for UX Researchers called Research Base, that would offer all research tasks under one platform roof. Everything from creating research Q&A and finding users, to affinity mapping, comp analysis, site maps, user flows, wireframes, and prototypes - all in one place. It would also be a home base of collaboration with other team members: designers, developers, PMs, etc.
So we set to work. Being a longtime producer, my instinct is to immediately create both a calendar and a project plan (below), which I then delivered to Mark with regular check-ins with him, to make sure we were on the same page. He immediately approved the plan.


We then came up with our list of questions, which included the following: “What platforms do you currently use to research, collaborate and share information?” “What are some workarounds that you’ve done to make a platform work for you?” “What are your current frustrations with any given research project?” “Walk us through a project with your team?” “What are the absolute musts you have with any given project?” “What does the structure of your team look like?”
We then found our Users, through both Mark’s connections and our own. We did 11 interviews over Zoom, ranging from 20 minutes to 40 minutes - some people had a lot to share!
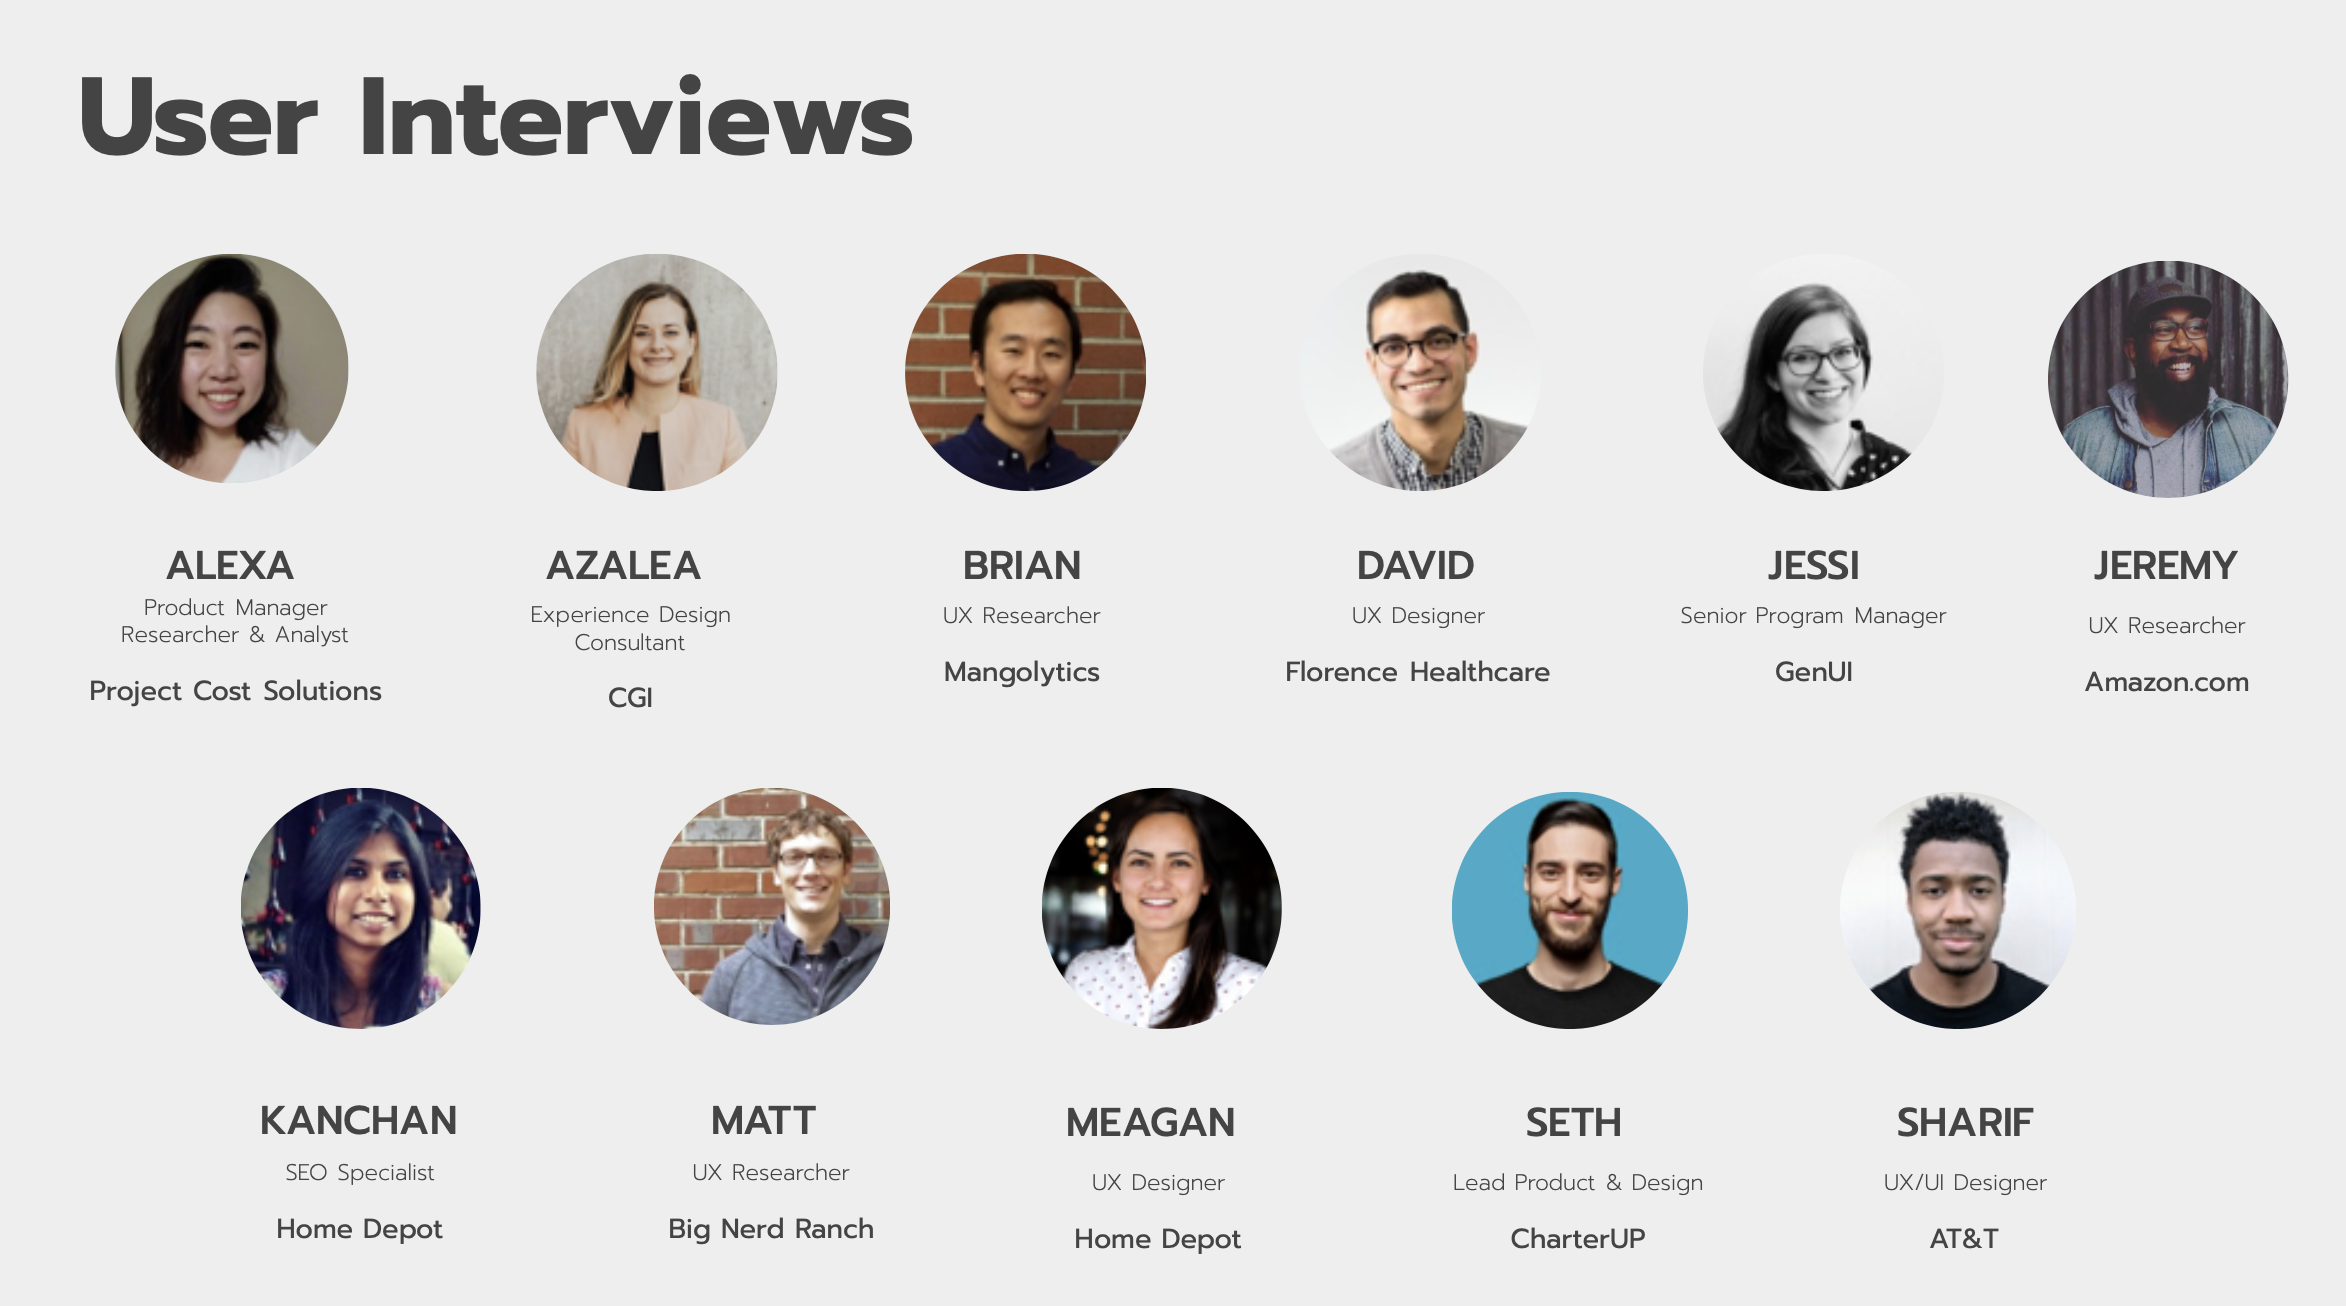
Here’s where we had our first “a-ha” pivot moment! Through affinity mapping (below), we found that most answers revolved around the same things: They didn’t mind going to different platforms (like Miro, Figma, and Sketch), and/or sketching w/ pen/paper. But they did think it would be nice to have them all as plug-ins, in one spot. Also, what came up the most, was transcribing all of their interviews. They said it was extremely time-consuming and draining. They also wished they had a way to #tag metadata and then have easy searchability later. And finally, they wanted those team collaboration abilities Mark had mentioned, but wanted to make sure they would still retain their ability to have administration control.


With this information, we did some additional competitive analyses, and then created our Persona, and our Problem and Solution. I wrote the statements and our team created the design.


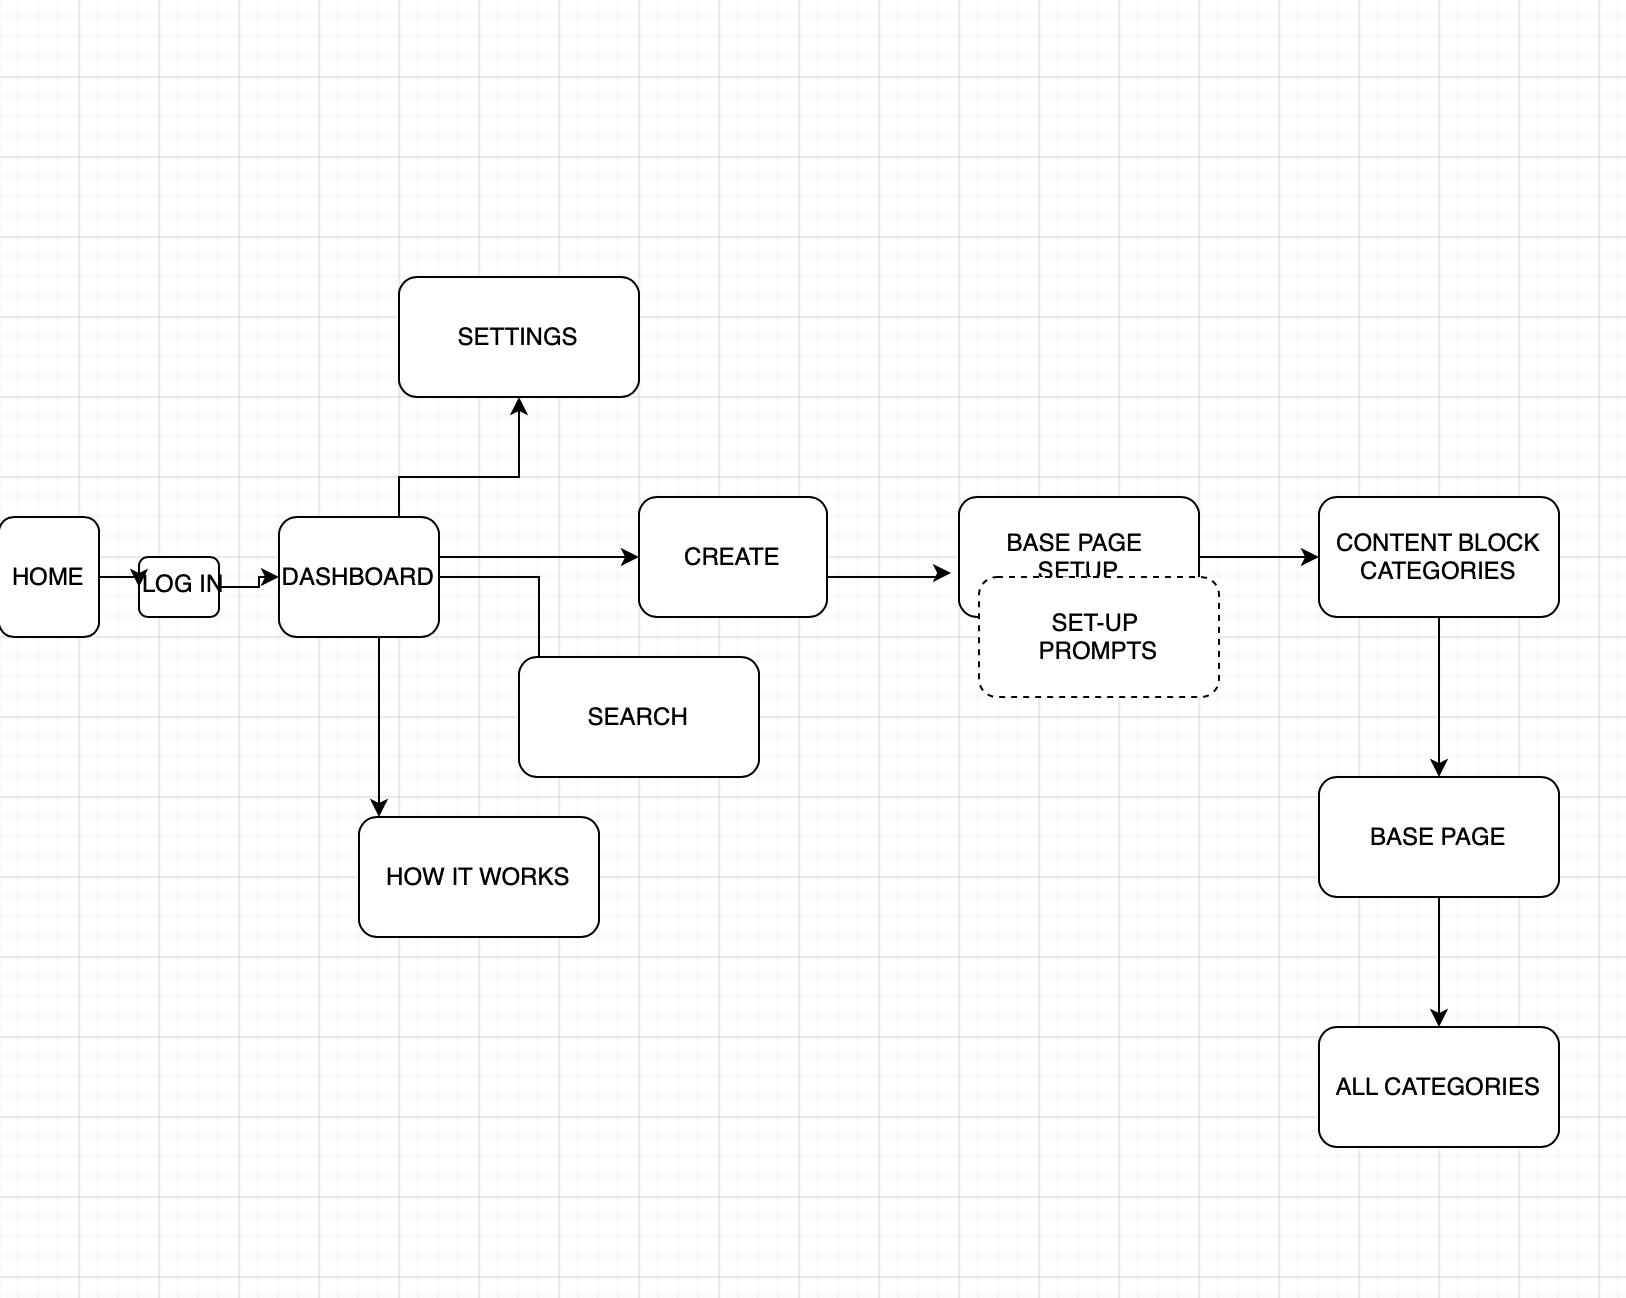
We realized that we could have a site where we would feature all of these elements, and created our first site map (which would later change) and user flow (which, shown here, is a second iteration). I created the journey map with emotion path & illustrations, and we presented it to Mark mid-way through the project.


We also decided that because the TRANSCRIPTION was so crucial to everyone, we would make that the key feature in our initial wireframes and prototype.

Meaza created the low-fi wireframes above, and I created the Prototype (below, in Figma, & click to play on video). Through this prototype testing (done over Zoom), we found out immediately where the User’s eye was going, what they were confused by, and where they were stuck. We made those changes immediately after the first couple of tests, and then tested again. This time we saw them move more smoothly. All in all, we tested with 5 different Users.

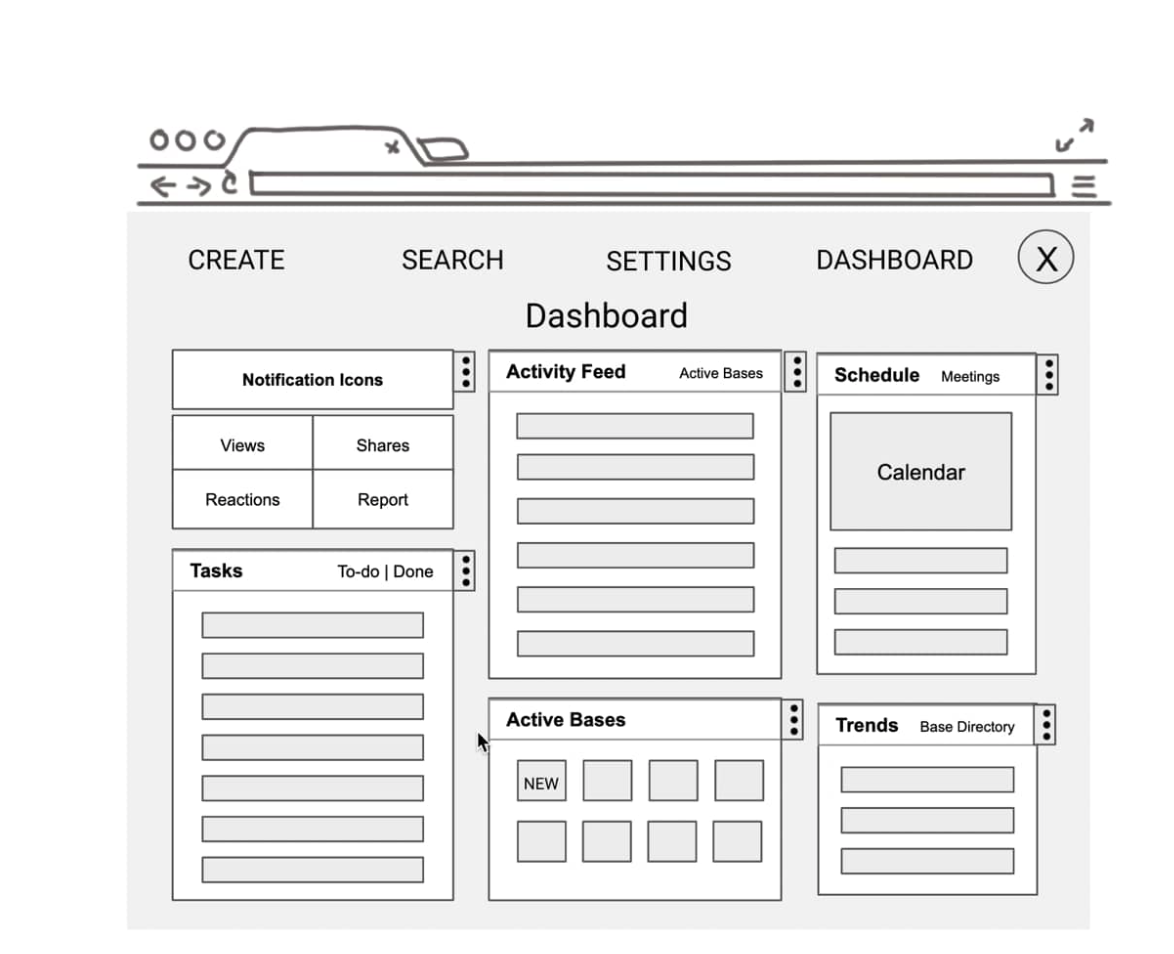
Finally we moved on to higher fidelity, prototyped it for our final presentation for Mark (below, click to play), and did a mockup of what the dashboard would look like once finished. I also wrote up the next steps.


We presented to Mark and an audience of 24 others, and walked him through it. I was the lead presenter (due to my many years of doing presentations in front of both small & large audiences) and passed the ball back and forth to my teammates. We then answered all of Mark’s follow-up questions fully and confidently….and it was a success.
I was also voted “Natural Born Leader” in my class of 23. Certificate earned - 500+ hours in 10 weeks. Boom.